Business Analytics Built on Live IEV ERP Data

Turn current business transactions into 50+ ready-to-view dashboards, interactive KPIs and cube-wise pivot reports across finance, procurement, inventory, production, quality and sales.

Move From the KPI to the Transaction Behind It

Every dashboard remains connected to the operational data that produced it. Review P&L, cash flow, ageing, purchase orders, stock valuation, production performance, quality, sales and dispatch from one analytics layer. Drill down from a summary or variance to the underlying IEV transaction. Management gets current answers without waiting for separately compiled MIS reports or reconciling multiple spreadsheets.
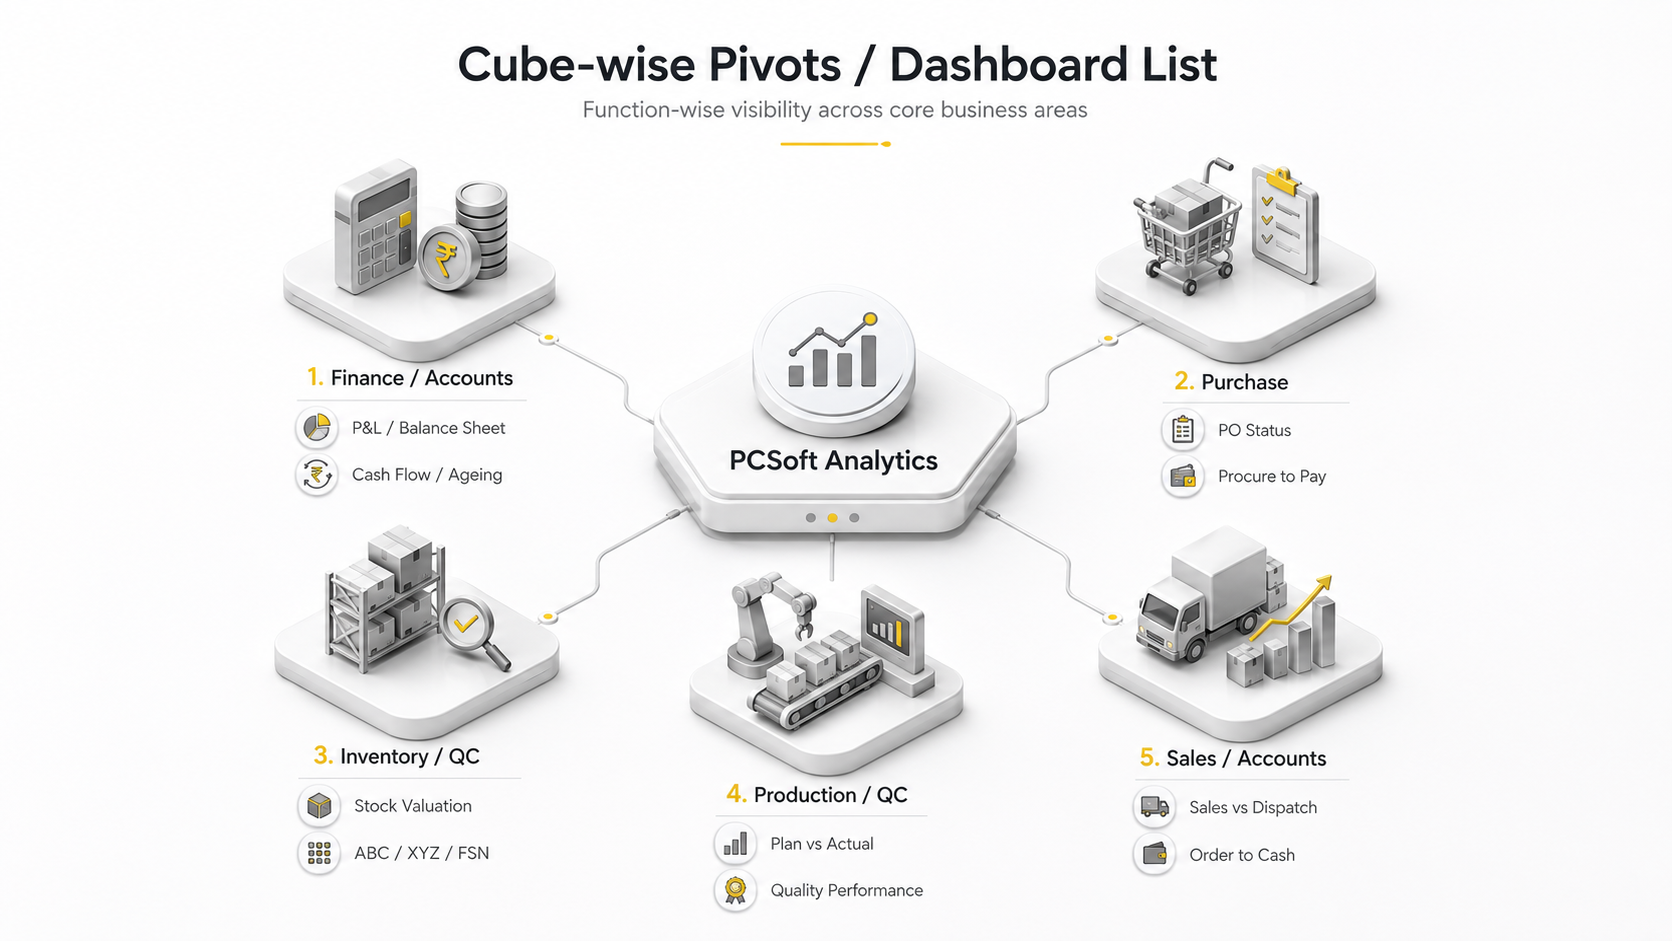
Visualise ERP Data. Understand Business Performance Faster.

Reporting Features That Go Beyond Standard MIS

Drill Down to Transaction-Level Details

Move from summary reports to the actual ERP transactions behind each number. Users can verify figures, audit results, identify incorrect entries, and trace reported data across accounts, inventory, purchase, sales, production, finance, GST, warranty, and other business modules without generating multiple reports for basic data verification.

Monitor 50+ Dashboards and KPIs

Track business performance through 50+ ready-to-view dashboards and KPI views built for different user groups and management levels. Teams can review finance, inventory, purchase, production, quality, sales, and operational metrics faster, while leadership gets a consolidated view of business health without waiting for manual MIS reports.

Customize Reports Around Business Needs

Create, modify, filter, and export reports based on internal review requirements. Users can structure reporting views around operational questions, audit checks, management reviews, and department-wise analysis, reducing dependency on external reporting tools while giving teams more flexibility to analyse ERP data in the format they need.

Analyse Data Across Multiple Dimensions

Study ERP data by company, location, period, customer, vendor, product, department, warehouse, and transaction type using cube-wise pivots and aggregation options. Teams can compare profitability, stock movement, production output, purchase trends, quality performance, and sales collections across multiple business angles.

Update Reports On Demand or in Batches

Refresh reports instantly when immediate visibility is required, or schedule batch updates for periodic review cycles. This supports monthly MIS, management dashboards, financial analysis, inventory reviews, production tracking, and cross-functional reporting where data accuracy and reporting timing directly influence business decisions.

Control Access at Warehouse and Role Level

Restrict reporting visibility based on warehouse, role, function, or responsibility. This is useful for multi-location and multi-department businesses where inventory, finance, sales, and operational data must be visible only to authorised users, improving reporting discipline, data security, and governance across the organisation.

See How Your ERP Data Can Work Harder

Get a walkthrough of PCSoft Analytics and see how dashboards, KPIs, drill-down reports, and ERP-driven business intelligence can support your management reviews.

KNOWLEDGE CENTRE

Industry Insights